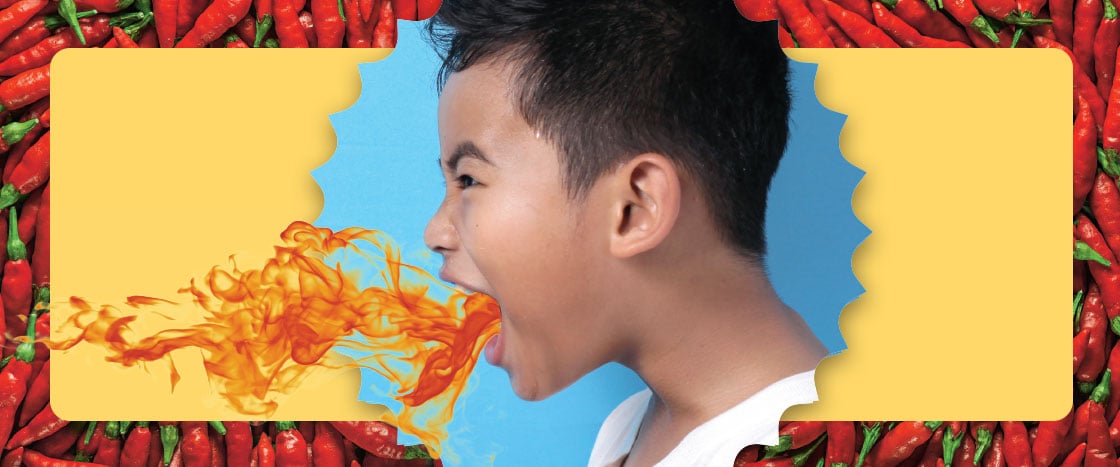
- Your eyes start to tear.
- You start to sweat.
- Your nose runs.

Standards
Shutterstock.com (All Images)
What happens when you eat spicy food?
How Hot Is It?
Chili peppers get their heat from a chemical called capsaicin*. The Scoville scale ranks a pepper’s heat by how much capsaicin it contains.
*pronounced kap-SAY-uh-suhn
PEPPER TYPE
Carolina Reaper
Ghost Pepper
Red Savina Habanero
Bell Pepper
SCOVILLE HEAT UNITS
1.5 -2.2 million
800,000 - 1 million
350,000 - 577,000
0
Countries With Super-Spicy Foods
These countries serve some of the hottest dishes on Earth.
- Mexico
- Thailand
- India
- Ethiopia
- Jamaica
- South Korea
How Spice Affects Your Health
- Capsaicin may help prevent sickness.
- Eating spicy food may help you live longer.
- Spicy food may improve heart health.
- Spicy food can upset your stomach.
- Capsaicin can make your mouth and throat feel like they’re burning.
- Super-spicy peppers can cause numbness, trouble breathing, and vomiting.
74% of Americans say they enjoy " at least some" spicy foods.
Write to Win
Imagine that a new restaurant is opening in your town. Write a letter to the owners explaining whether or not they should include spicy dishes on the menu. Use information from the infographic. Send your letter to “Spicy Contest” by February 1, 2022. Five winners will each receive a Storyworks prize. Visit the Storyworks Contests page for more information.
This infographic was originally published in the December 2021 / January 2022 issue.
1. Reading and Discussing
Project the infographic as students follow along in their magazines.
Prompt students to use the headline, subhead, and central image to identify the topic of the infographic.
Ask: Is the purpose of the infographic to
- explain something to you?
- convince you of something?
- tell you how to do something?
Have students look over the labels and images surrounding the central image. Ask:
- How are they related to the central image? (They provide details about the main idea.)
Break students into groups to read each section of the infographic and discuss what they find interesting, surprising, or convincing.
Come back together as a class and ask volunteers to summarize the main idea and supporting details from the infographic.
2. Writing
Preview the writing prompt in the “Write to Win” box.
Download and distribute the guided-writing activity that goes along with the infographic.
Have students respond to the writing prompt. If you wish, send their responses to our infographic contest.
3. Ideas to Engage and Inspire
Have students create their own infographics! Download our “Make Your Own Infographic” activity from Storyworks Digital.
