- America produces 1.5 billion pounds of pumpkins every year.
- The world’s largest pumpkin pie was 20 feet wide.
- Americans spent $488 million on pumpkin-flavored foods last year.
Pumpkins by the Numbers

Carve out some time to learn about this fall favorite!
How did people start carving pumpkins into jack-o’-lanterns? This Wonderopolis article explains the Irish legend behind the Halloween tradition.
Prepare to be wowed by this fascinating time-lapse video of a giant pumpkin growing to a whopping 636 pounds!
More About the Story
Skills
reading for information, evaluating
Complexity Factors
Purpose
The infographic provides a range of facts about pumpkins.
Structure
Information is presented using text, text boxes, images, numbers, and a map.
Language
The language is mainly conversational but includes some wordplay (the expression “carve out some time”).
Knowledge Demands
The infographic refers to Ireland, India, and Antarctica. It also mentions large numbers, such as 1.5 billion.
1. Reading and Discussing
Project the infographic as students follow along in their magazines.
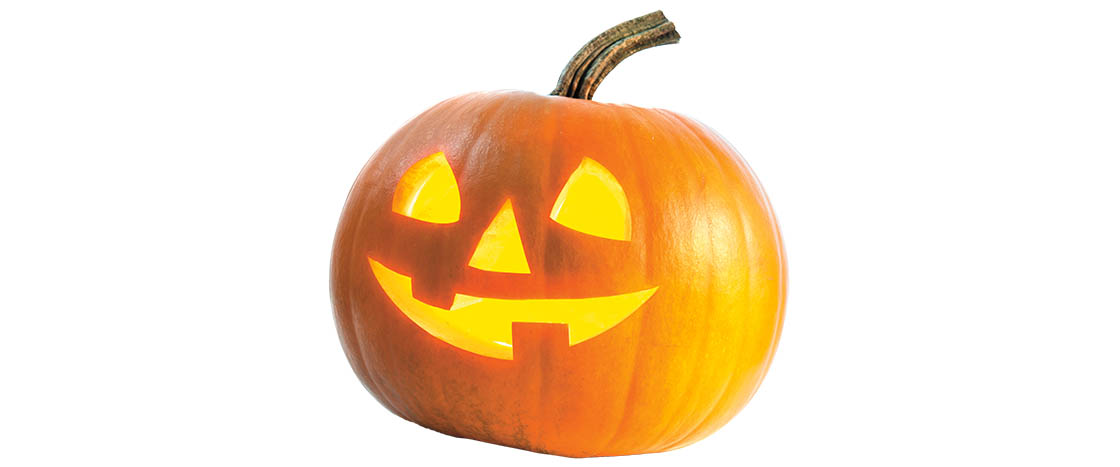
Prompt students to use the headline, subhead, and central image to identify the topic of the infographic.
Ask: Is the purpose of the infographic to
Have students look over the labels and images surrounding the central image. Ask:
Break students into groups to read each section of the infographic and discuss what they find interesting, surprising, or convincing.
Come back together as a class and ask volunteers to summarize the main idea and supporting details from the infographic.
2. Writing
Preview the writing prompt in the “Write to Win” box.
Download and distribute the guided-writing activity that goes along with the infographic.
Have students respond to the writing prompt. If you wish, send their responses to our infographic contest.
Ideas to Engage and Inspire
Have students create their own infographics! Download our “Make Your Own Infographic” activity from Storyworks Digital.