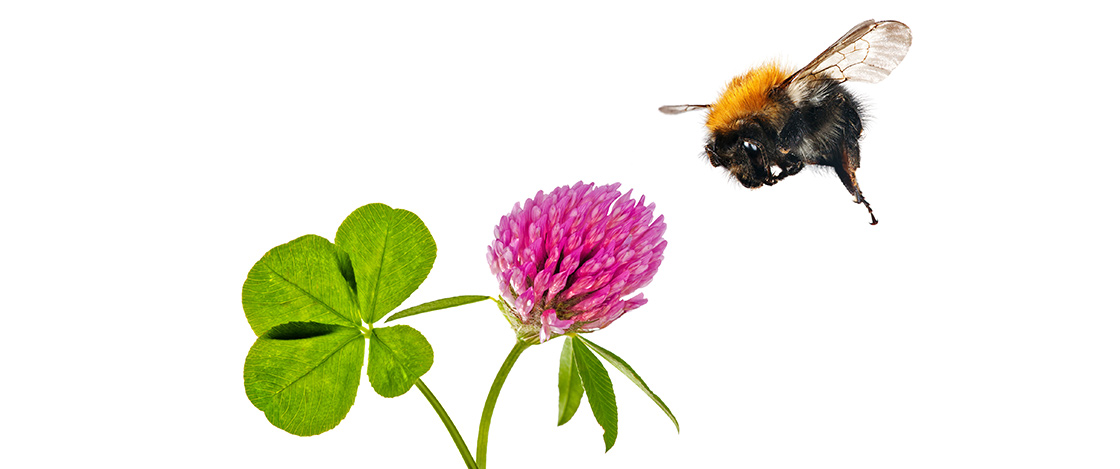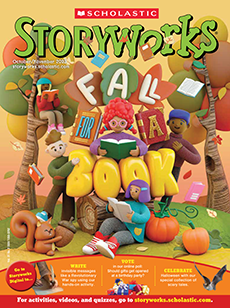
Save the Bees!
These fuzzy insects may be tiny, but they have a BIG impact on the planet—and they’re in serious danger.
Complexity Factors
Levels of Meaning
The infographic provides information on the role bees play in food production, the decrease in bee populations, and how humans can help prevent bees from becoming extinct.
Structure
Information is presented through text, text boxes, statistics, and images.
Language
The language is mainly conversational but includes the word species.
Knowledge Demands
Basic knowledge of pollination is helpful but not necessary.
1. Reading and Discussing
Project the infographic as students follow along in their magazines.
Prompt students to use the headline, subhead, and central image to identify the topic of the infographic.
Ask: Is the purpose of the infographic to
- explain something to you?
- convince you of something?
- tell you how to do something?
Have students look over the labels and images surrounding the central image. Ask:
- How are they related to the central image? (They provide details about the main idea.)
Break students into groups to read each section of the infographic and discuss what they find interesting, surprising, or convincing.
Come back together as a class and ask volunteers to summarize the main idea and supporting details from the infographic.
2. Writing
Preview the writing prompt in the “Write to Win” box.
Download and distribute the guided-writing activity that goes along with the infographic.
Have students respond to the writing prompt. If you wish, send their responses to our infographic contest. Details are at Storyworks Online.
Ideas to Engage and Inspire
Have students create their own infographics! Download our “Make Your Own Infographic” activity from Storyworks Online.
